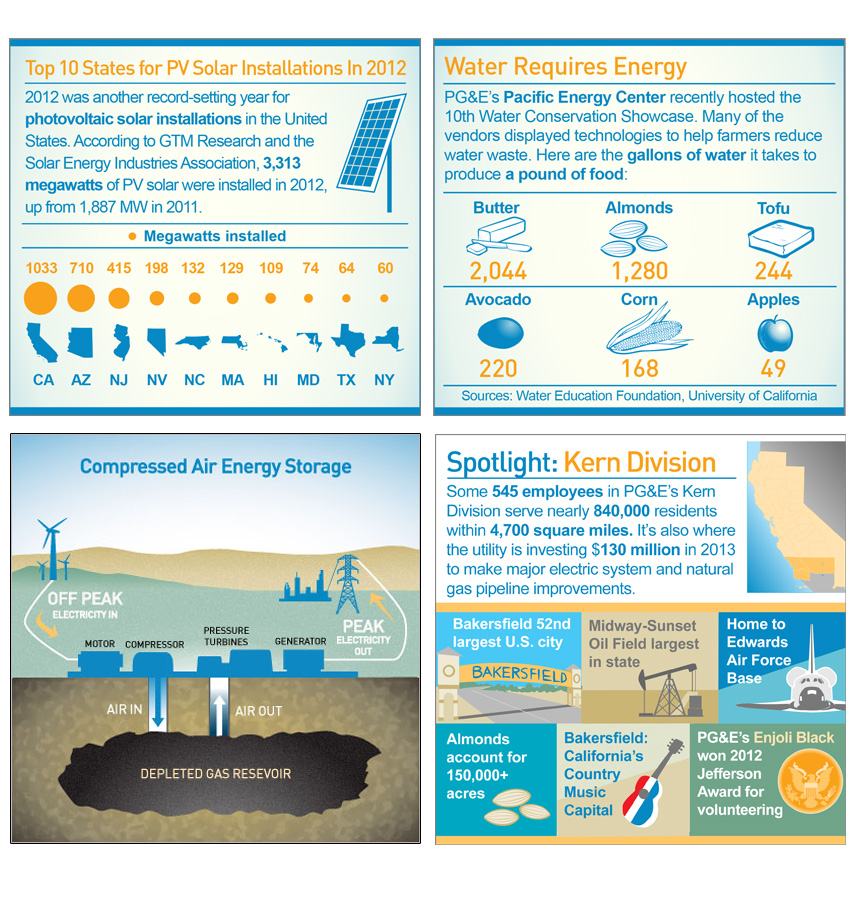
 Selected infographics from PG&E. Top left: A comparative chart of solar voltaic installations by state. Top right: Water requirements for growing types of food. Bottom right: Spotlight on PG&E’s service territory regions. Bottom left: A schematic view of Compressed Air Energy Storage. This new technology captures low-cost renewable energy during off-peak times and distributes during periods of high demand.
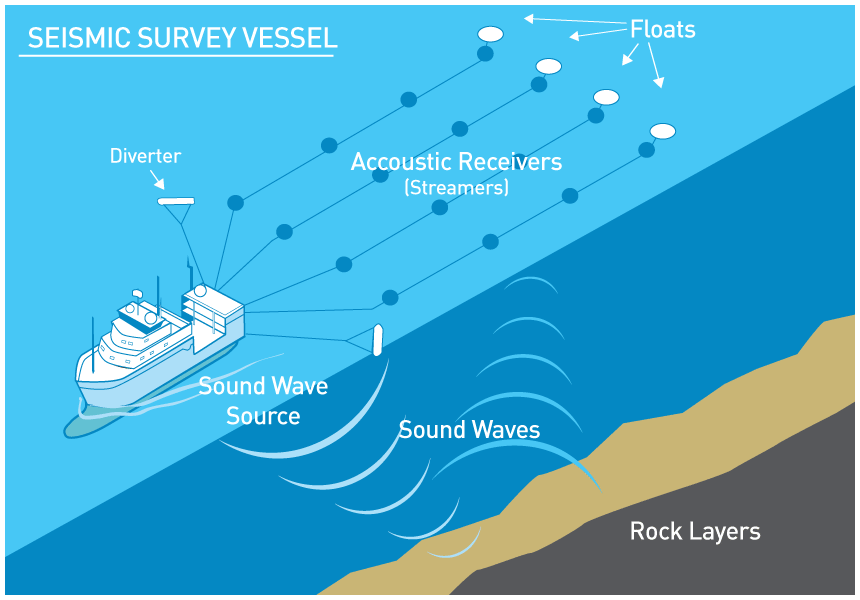
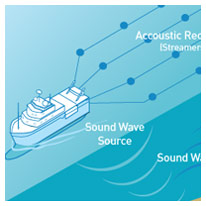
Seismic survey vessel infographic.