
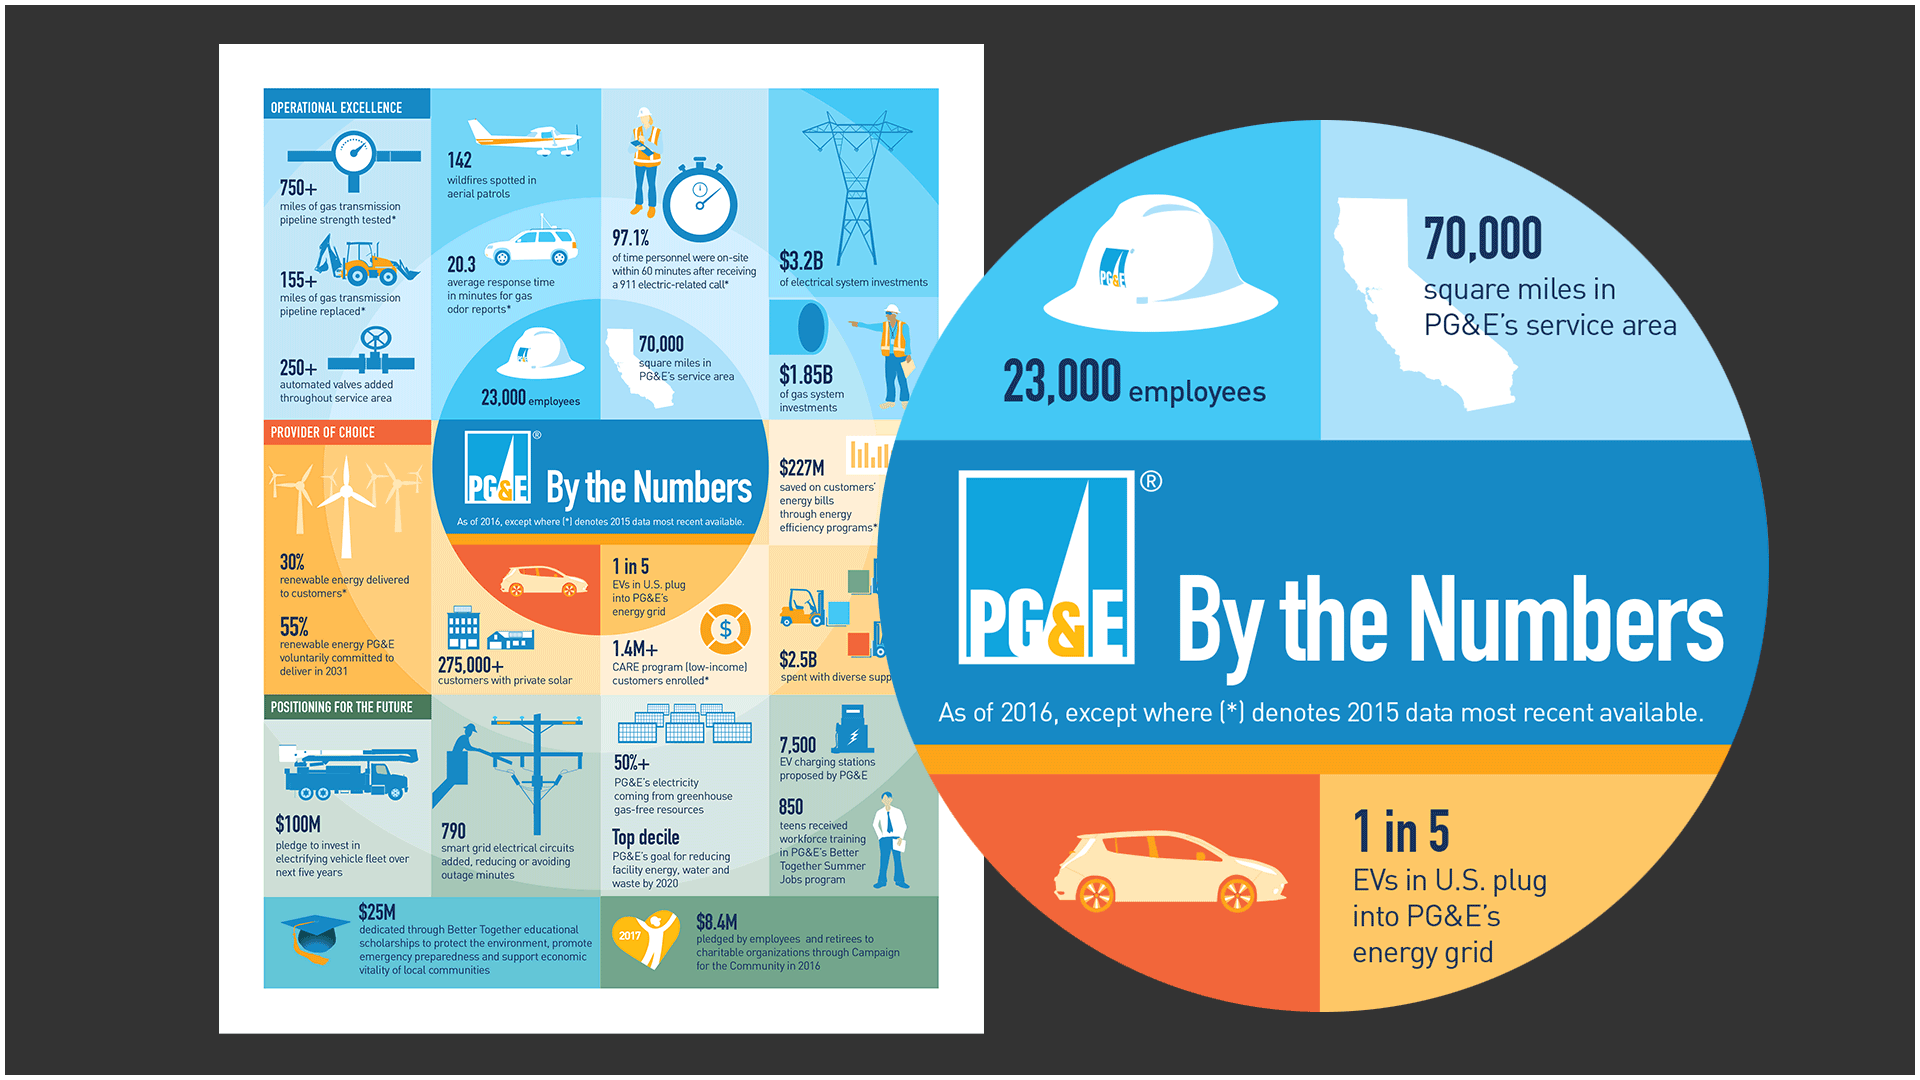
 PG&E By the Numbers.
 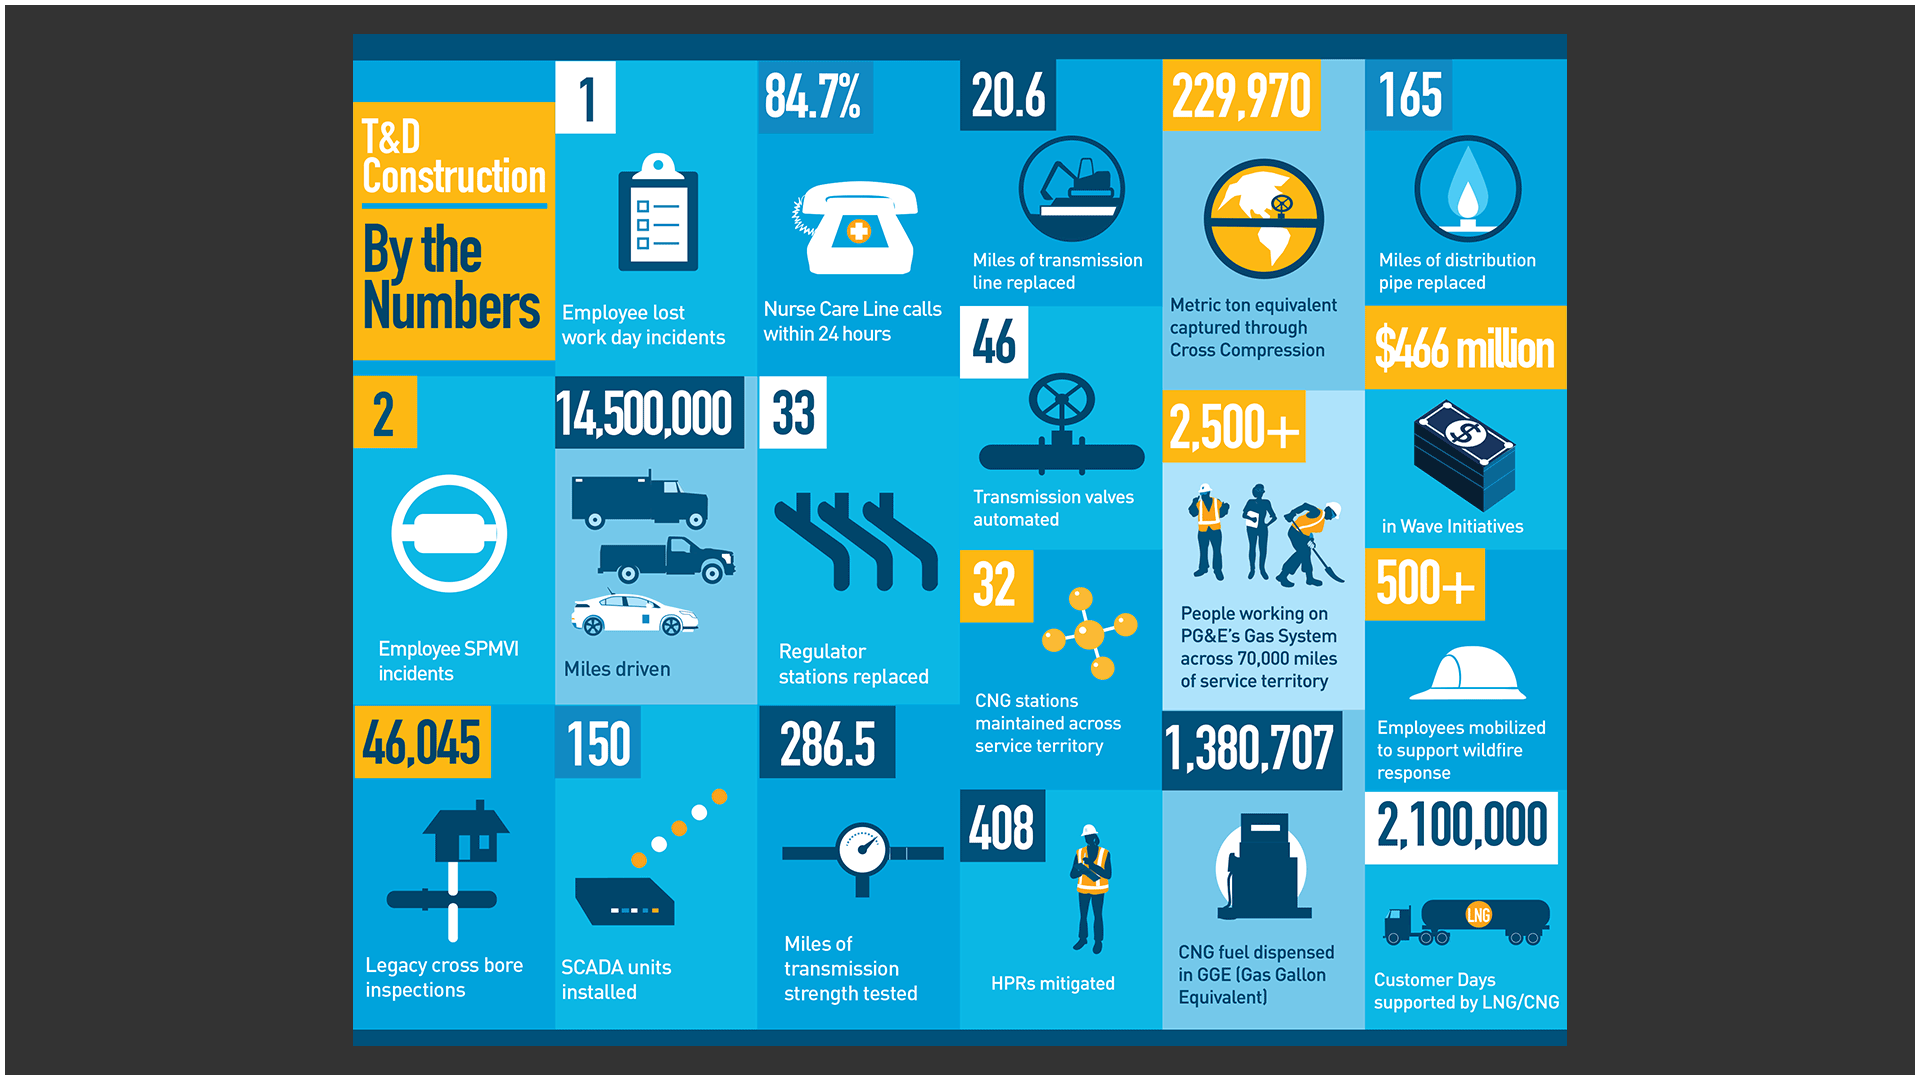 PG&E Gas T&D Construction: By the Numbers.
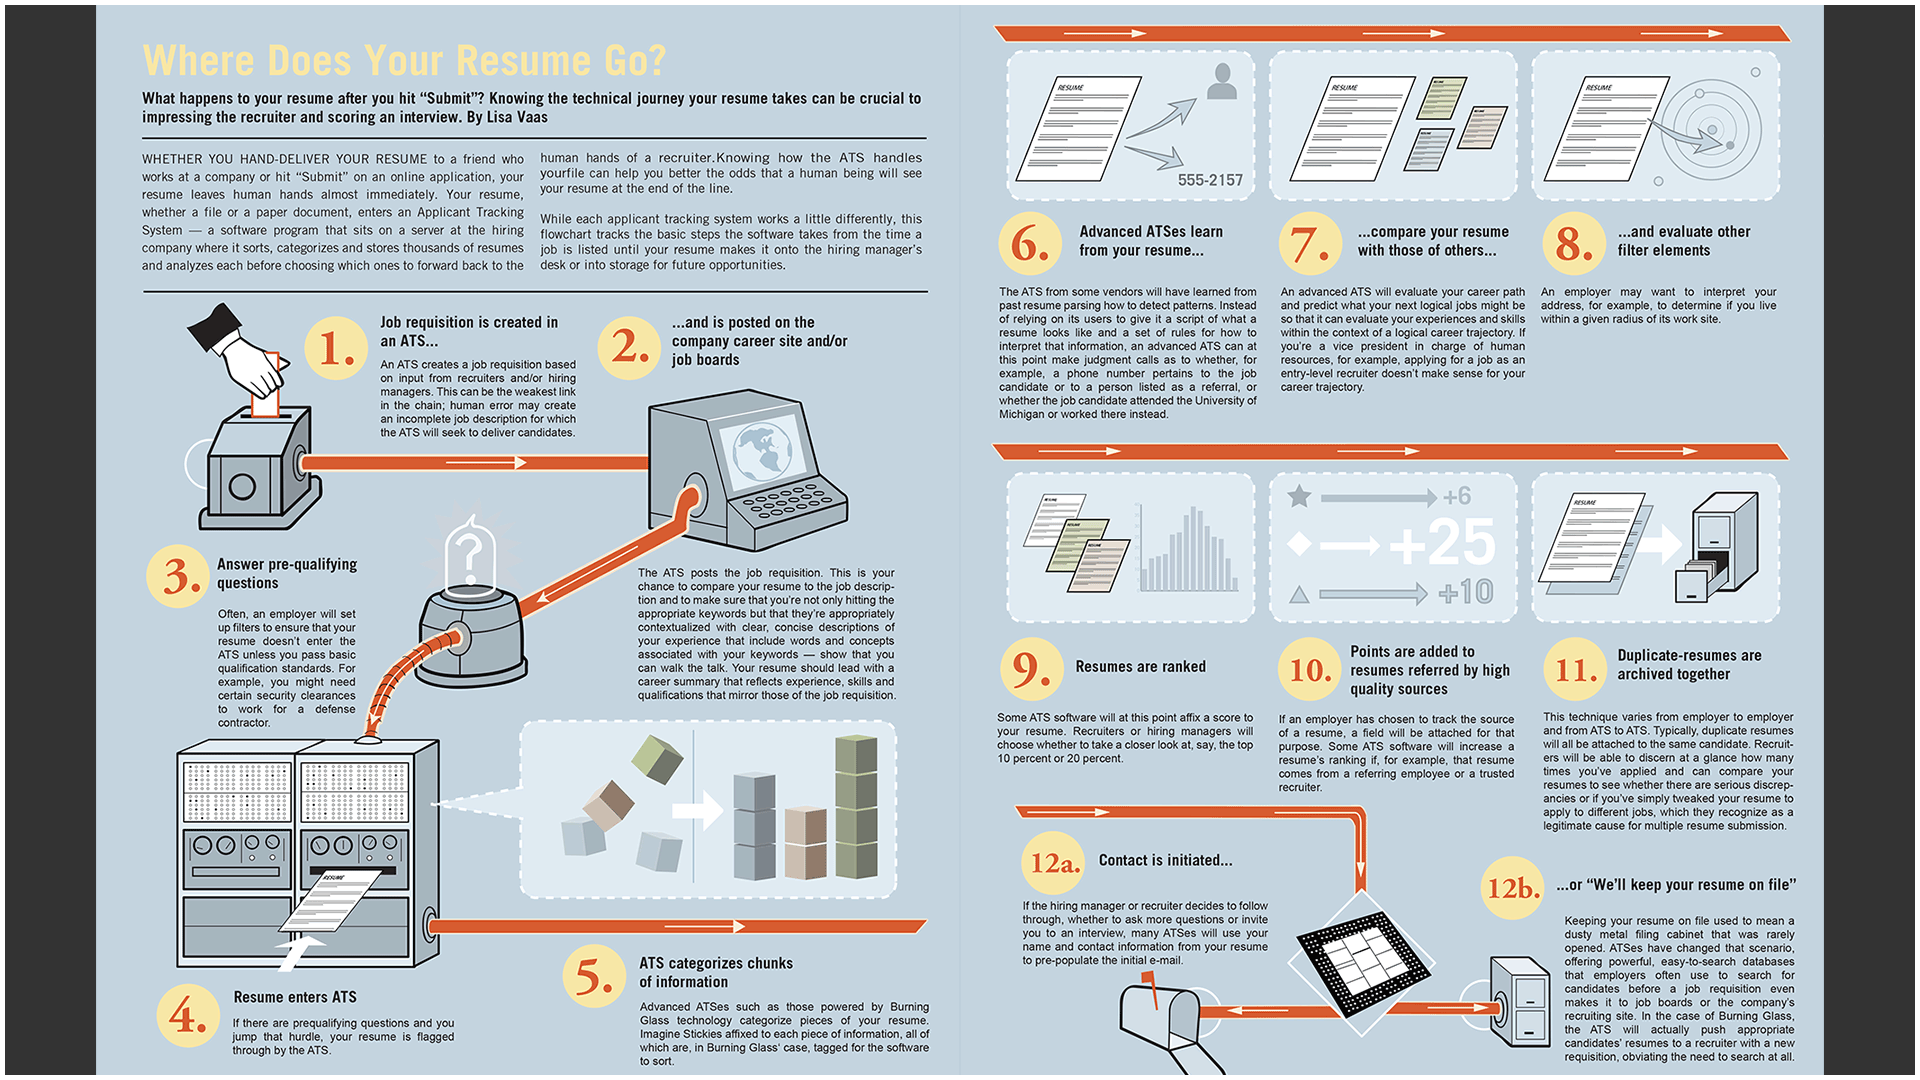 Where Does Your Resume Go? The Ladders newsletter.
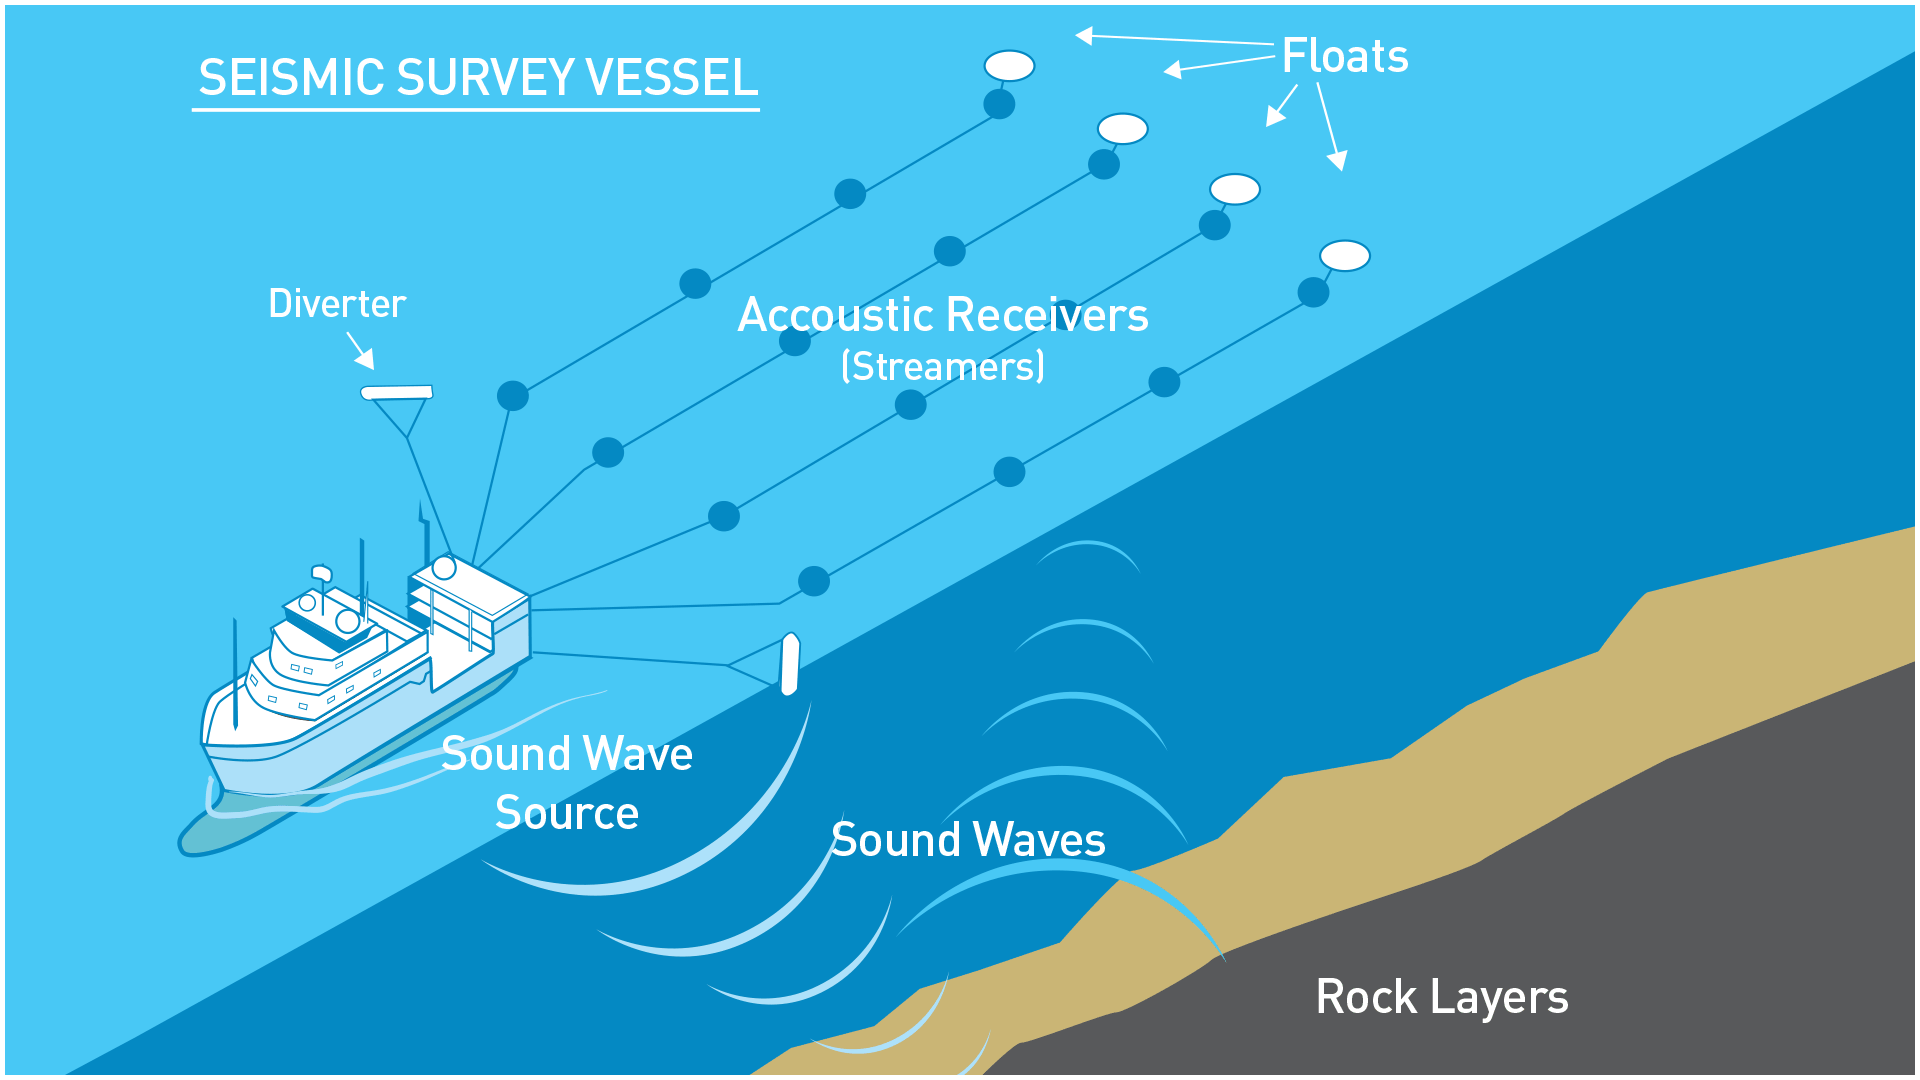 Seismic survey schematic drawing. Vector art created in Adobe Illustrator.
 Technical infographic: Strength Testing Improves PG&E Gas Pipeline Safety.
 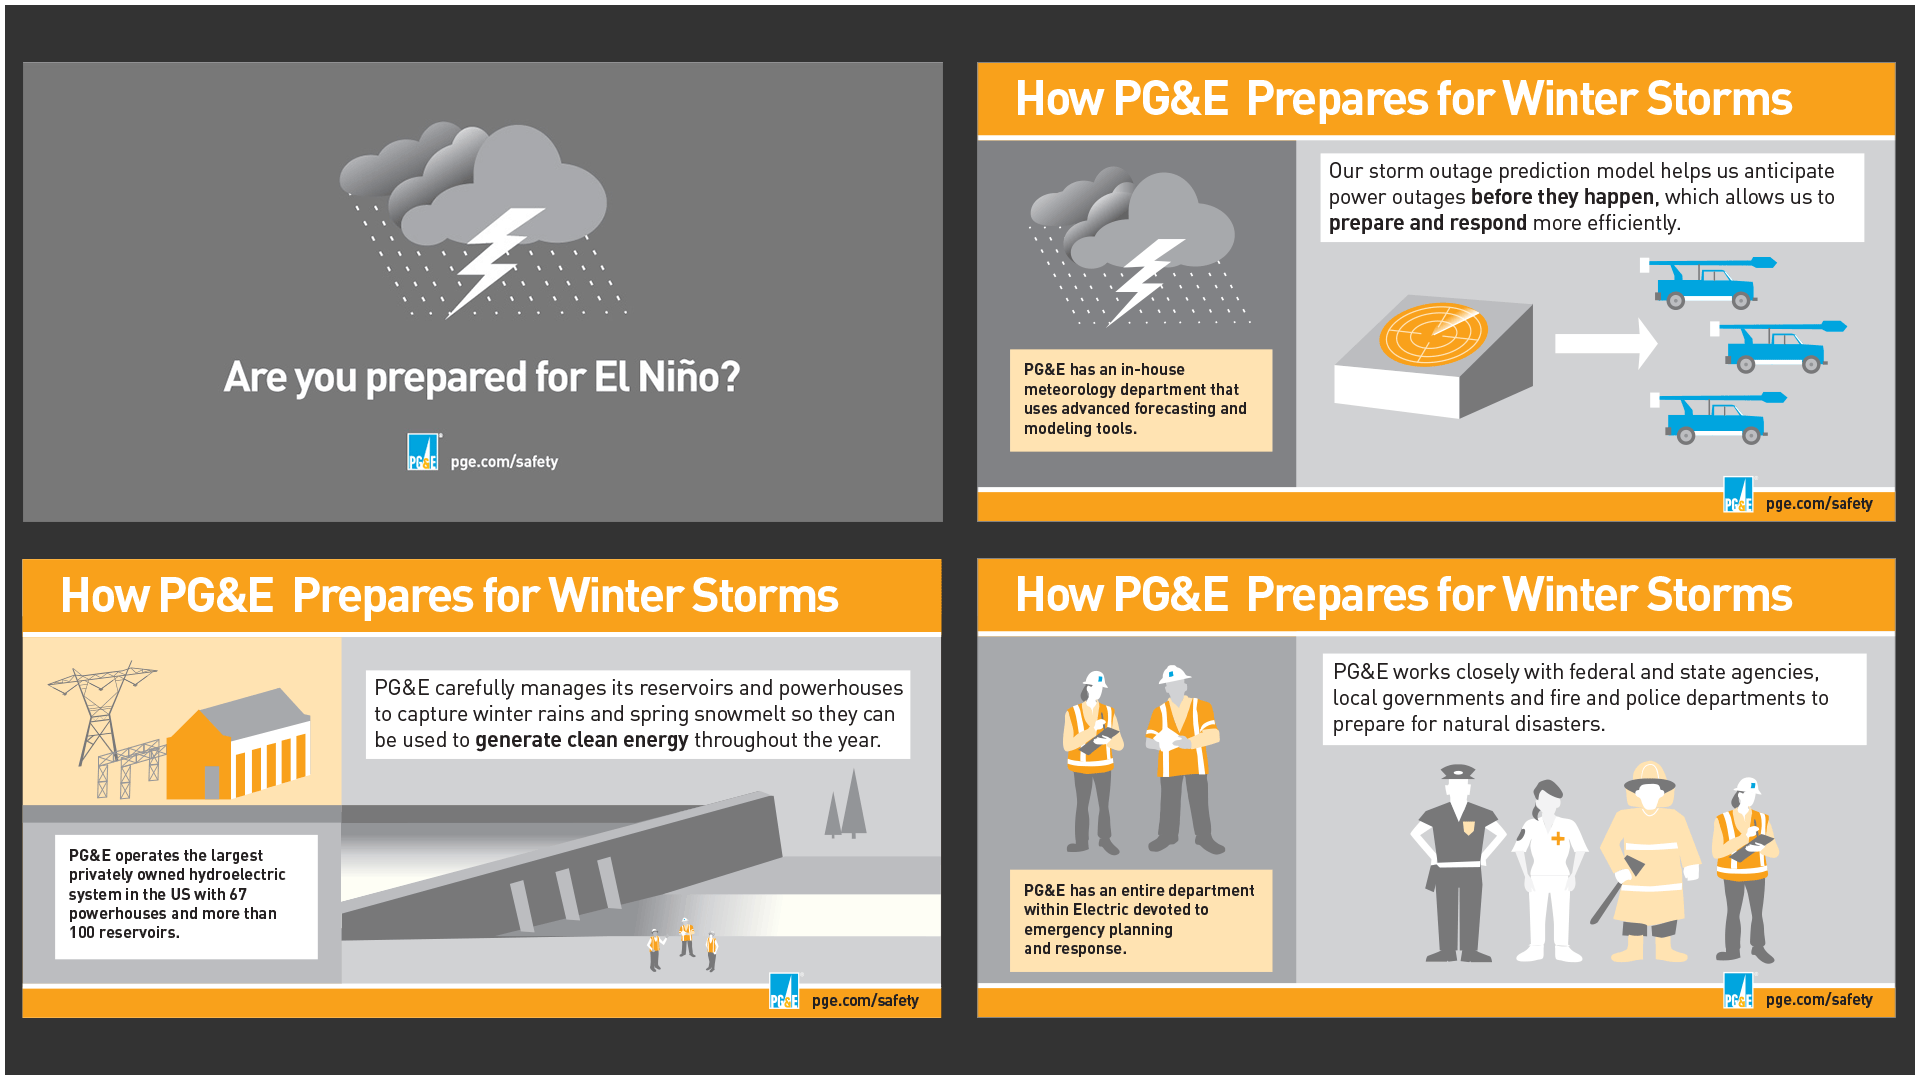 How PG&E Prepares for Winter Storms. (Media campaign.)
Pictures are not only worth a thousand words, they can also make clearer what pure numbers can’t do alone. Here are some samples of data visualization, technical drawings and infographics for various publications.